Neighborhood-Based Obesity Risk in Aging Populations
3 years, 2 months ago
12043
0
Posted on Feb 01, 2021, 7 p.m.
More than a third of adults in the United States have obesity, and people who live in socioeconomically disadvantaged neighborhoods with lower-income and less-educated populations have a higher risk of obesity. This includes older adult populations, which continue to grow and increase the demand for health care.
In fact, Americans born between 1946 and 1962 have the highest obesity rate of any age group, and as they age, their high obesity rates could make their health care more challenging. An NIMHD-supported study has shown that using a neighborhood-based index of socioeconomic disadvantage measures could help predict obesity risk in older adults.
The study included more than 4,000 Medicare beneficiaries age 65 or older who received care from the University of Missouri Health System between 2013 to 2014. The researchers used the Area Deprivation Index (ADI), a tool to measure neighborhood disadvantage based on 17 markers of socioeconomic status, such as income and poverty levels, education level, and employment. Each participant had an ADI score assigned according to his/her mailing address. (See Figure 1, a U.S. map illustrating neighborhood disadvantage levels from ADI scores across the country.) Obesity was defined as body mass index of 30 or higher.
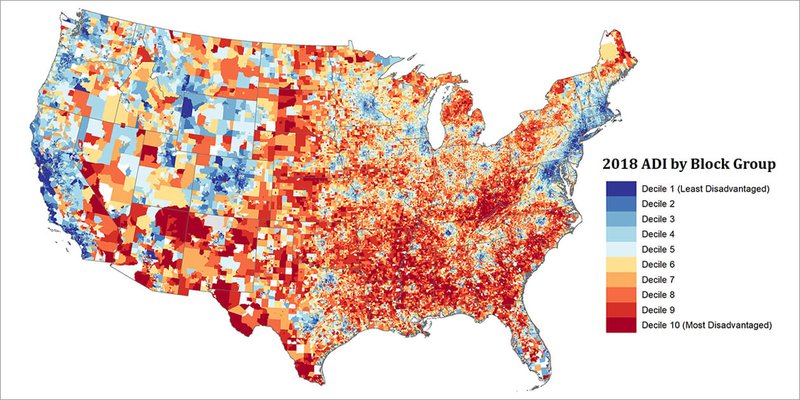
Figure 1: Neighborhood Disadvantage Map of the United States based on the 2018 Area Deprivation Index. Image provided by the Health Services and Care Research Program, Department of Medicine, University of Wisconsin School of Medicine and Public Health.
Using the ADI, the researchers found that obesity was least common in the neighborhoods of least disadvantage. More disadvantaged neighborhoods were linked to higher rates of obesity. Medicare patients whose health records included no BMI data were more likely to live in the most disadvantaged areas.
Findings from this study support the use of the ADI to predict neighborhood socioeconomic disparities and obesity risk in older populations. Potential reasons for the higher obesity risk in neighborhoods of socioeconomic disadvantage include having fewer healthy food options and a lack of safe places to exercise. Policymakers could use this information to better distribute resources to communities that may benefit from increased access to fresh food, parks, and recreational areas. Health professionals can make sure that patients get their weight and BMI measured regularly. Professionals may also suggest ways for patients to eat healthier and exercise safely in their neighborhoods—especially for more vulnerable older adults.
Research Examines Effects of Disadvantaged Neighborhoods on Long-Term Health
From a young age, growing up in rural northern Wisconsin and the Upper Peninsula of Michigan, Amy Kind, M.D., Ph.D., witnessed and understood how a person’s environment can influence their health—for better or for worse.
“I grew up in areas in which socioeconomic disadvantage was, and still is, commonplace,” Dr. Kind says. “The impact of poverty on health is profound.”
“Living in a disadvantaged neighborhood is associated with access to food, safety, environmental exposures, and many other health-related factors,” she says. “Individuals who live in such neighborhoods are more apt to develop certain diseases and to die earlier from those diseases.”
Dr. Kind saw these effects firsthand in her friends and family, and secondhand, as her mother, a mental health nurse, struggled to care for her patients and help them care for themselves in a labyrinth of obstacles.
“It was clear,” Dr. Kind says, “that there was, and still is, a compelling and urgent need to improve the system.”
Now a health policy and implementation science researcher, a practicing geriatrician, and an associate professor of geriatrics and gerontology at the University of Wisconsin School of Medicine and Public Health, Dr. Kind has spent years studying how to do just that.
“Neighborhoods all over the United States are impacted by socioeconomic disadvantage,” Dr. Kind says. Not only is it harder for members of these communities to stay healthy, she says, but many disadvantaged areas are also “severely lacking in the resources or service capacity to manage the health consequences that follow. It is critical to the well-being of our country that we find new and better ways to improve health in these disadvantaged neighborhoods.”
Better Tools for Better Health
That improvement begins with research and understanding.
“Being able to identify neighborhood disadvantage is one of the first critical steps on the journey toward fixing these problems,” Dr. Kind says. “Yet this step is challenging, especially on a national level.”
Dr. Kind saw promise in a metric called the Area Deprivation Index (ADI). The ADI, which was first developed by the U.S. government in the 1990s, used census data to examine socioeconomic advantage and disadvantage across the country. The index relied on an old data format and concerned only large geographic areas—two factors that limited its usefulness for researchers interested in neighborhood-level data.
Even so, Dr. Kind says, “We felt that it had potential as a neighborhood disadvantage metric given its prior validation track record and theory-based construction.”
The framework was already in place; it was the specifics that needed an upgrade. So Dr. Kind and her colleagues got to work making the ADI work for them, updating the data and shrinking the geographic parameters to the neighborhood level.
This involved using geoanalytic methods to link the nearly 500,000 neighborhoods in the United States with more than 50 million nine-digit ZIP codes.
“This has been an extremely complex data task, which has been tremendously challenging but absolutely necessary,” Dr. Kind says. “By taking this step, we make the ADI much easier to use. This way, anyone with a ZIP code of interest can find out the disadvantage of that particular area—or those interested in targeting areas of disadvantage can find them by their ZIP codes.”
Information for All
This is a good start, but Dr. Kind wants the data to be even more accessible. She and her colleagues want to build an online resource that allows rapid mapping of neighborhood disadvantage in any U.S. city, county, or state.
“My hope is that by making this information easier to access and to understand,” she says, “we will be able to contribute to even more policy, resource, and intervention discussions across the United States.”
Their work is already gaining traction.
In her work as an implementation science researcher, Dr. Kind works with the U.S. Centers for Medicare and Medicaid Services (CMS), developing and testing new approaches to improving patient health outcomes in low-resource settings.
The CMS Everyone with Diabetes Counts (EDC) program provides diabetes self-management support to disadvantaged populations in all 50 states in an effort to reduce diabetes disparities. EDC leadership was intrigued by Dr. Kind’s approach to neighborhood disadvantage research and decided to test the data resource for themselves.
“The EDC program is now using our refined ADI to target diabetes education efforts with seniors residing in the most disadvantaged neighborhoods, in addition to targeting traditional individual disparities,” Dr. Kind says.
“EDC uses the ADI to add neighborhoods in each state that had not previously been identified for inclusion, allowing EDC’s diabetes prevention and outreach classes to reach additional seniors in need.”
It’s an exciting development, Dr. Kind says, and she believes there are many more to come.
She explains that by developing interventions or policies that target specific neighborhoods—and the individuals in those neighborhoods—there may be more natural opportunities for finding populations in need, for more efficiently targeting scarce resources, and for synergizing with other existing resources within an area.
“In our work, we will continue to develop new ways to improve targeting of disadvantaged neighborhoods and will continue to conduct research studies to help us learn more about the impact of neighborhood socioeconomic contextual disadvantage on health—all with the hope of improving health disparities and of helping others to do the same. The ADI has the potential to help us do just this. It is a first practical step in this journey, but definitely not the last.” Neighborhood Atlas Map
As with anything you read on the internet, this article should not be construed as medical advice; please talk to your doctor or primary care provider before making any changes to your wellness routine.
Materials provided by:
Content may be edited for style and length.
This article is not intended to provide medical diagnosis, advice, treatment, or endorsement
Figure 1: Neighborhood Disadvantage Map of the United States based on the 2018 Area Deprivation Index. Image provided by the Health Services and Care Research Program, Department of Medicine, University of Wisconsin School of Medicine and Public Health.
https://www.nimhd.nih.gov/news-events/research-spotlights/neighborhood-obesity.html
Sheets, L. R., Henderson Kelley, L. E., Scheitler-Ring, K., Petroski, G. F., Barnett, Y., Barnett, C., . . . Parker, J. C. (2020). An index of geospatial disadvantage predicts both obesity and unmeasured body weight. Preventive Medicine Reports, 18, 101067. doi:10.1016/j.pmedr.2020.101067
https://www.nimhd.nih.gov/news-events/features/community-health/disadvantaged-neighborhoods.html
https://www.neighborhoodatlas.medicine.wisc.edu/mapping
- Hu, J., Kind, A. J. H., & Nerenz, D. (2018). Area deprivation index predicts readmission risk at an urban teaching hospital. American Journal of Medical Quality. Advance online publication. doi: 10.1177/1062860617753063
- Lantos, P. M., Hoffman, K., Permar, S. R., Jackson, P., Hughes, B. L., Kind, A. J. H., & Swamy, G. (2017). Neighborhood disadvantage is associated with high cytomegalovirus seroprevalence among pregnant women. Journal of Racial and Ethnic Health Disparities. Advance online publication. doi: 10.1007/s40615-017-0423-4
- Kind, A. J. H., Jencks, S., Brock, J., Yu, M., Bartels, C., Ehlenbach, W., . . . Smith, M. (2014). Neighborhood socioeconomic disadvantage and 30-day rehospitalization: A retrospective cohort study. Annals of Internal Medicine, 161(11), 765-774. doi: 10.7326/M13-2946
- Kind, A. J. H., Jensen, L., Barczi, S., Bridges, A., Kordahl, B., Smith, M., & Asthana, S. (2012). Low-cost transitional care with nurse managers making mostly phone contact with patients cut rehospitalization at a VA hospital. Health Affairs, 31(12), 2659-2668. doi: 10.1377/hlthaff.2012.0366
- Kind, A. J. H., Brenny-Fitzpatrick, M., Leahy-Gross, K., Mirr, J., Chapman, E., Frey, B., & Houlahan, B. (2016). Harnessing protocolized adaptation in dissemination: Successful implementation and sustainment of the Veterans Affairs Coordinated-Transitional Care (C-TraC) Program in a non-Veterans Affairs hospital. Journal of the American Geriatrics Society, 64(2), 409-416. doi: 10.1111/jgs.13935
- Kind, A. J. H., Jensen, L., & Kennelty, K.A. (2014). Far too easy: Opioid diversion during the transition from hospital to nursing home. Journal of the American Geriatrics Society, 62(11), 2229-2231. doi: 10.1111/jgs.13084
- Kennelty, K., Jensen, L., Gehring, M., Gilmore-Bykovskyi, A., Roiland, R., Kordahl, R., & Kind A. J. H. (2016). Preventing Opioid Prescription Theft and Ensuring SeCure Transfer of Personal Health Information when patients transition from the hospital to a nursing home. Journal of the American Geriatrics Society, 64(9), 23-25. doi: 10.1111/jgs.14212